| Model 01 | Model 02 | Model 03 | Model 04 | |
| ESeC 79 | ||||
| 1965-69 | 1.00 | 1.00 | 1.00 | 1.00 |
| 1970-74 | 0.99 | 1.00 | 0.97 | 0.97 |
| 1975-79 | 1.05 | 1.06 | 1.01 | 1.01 |
| 1980-84 | 1.03 | 1.04 | 1.01 | 0.99 |
| 1985-90 | 0.94 | 0.95 | 0.92* | 0.91* |
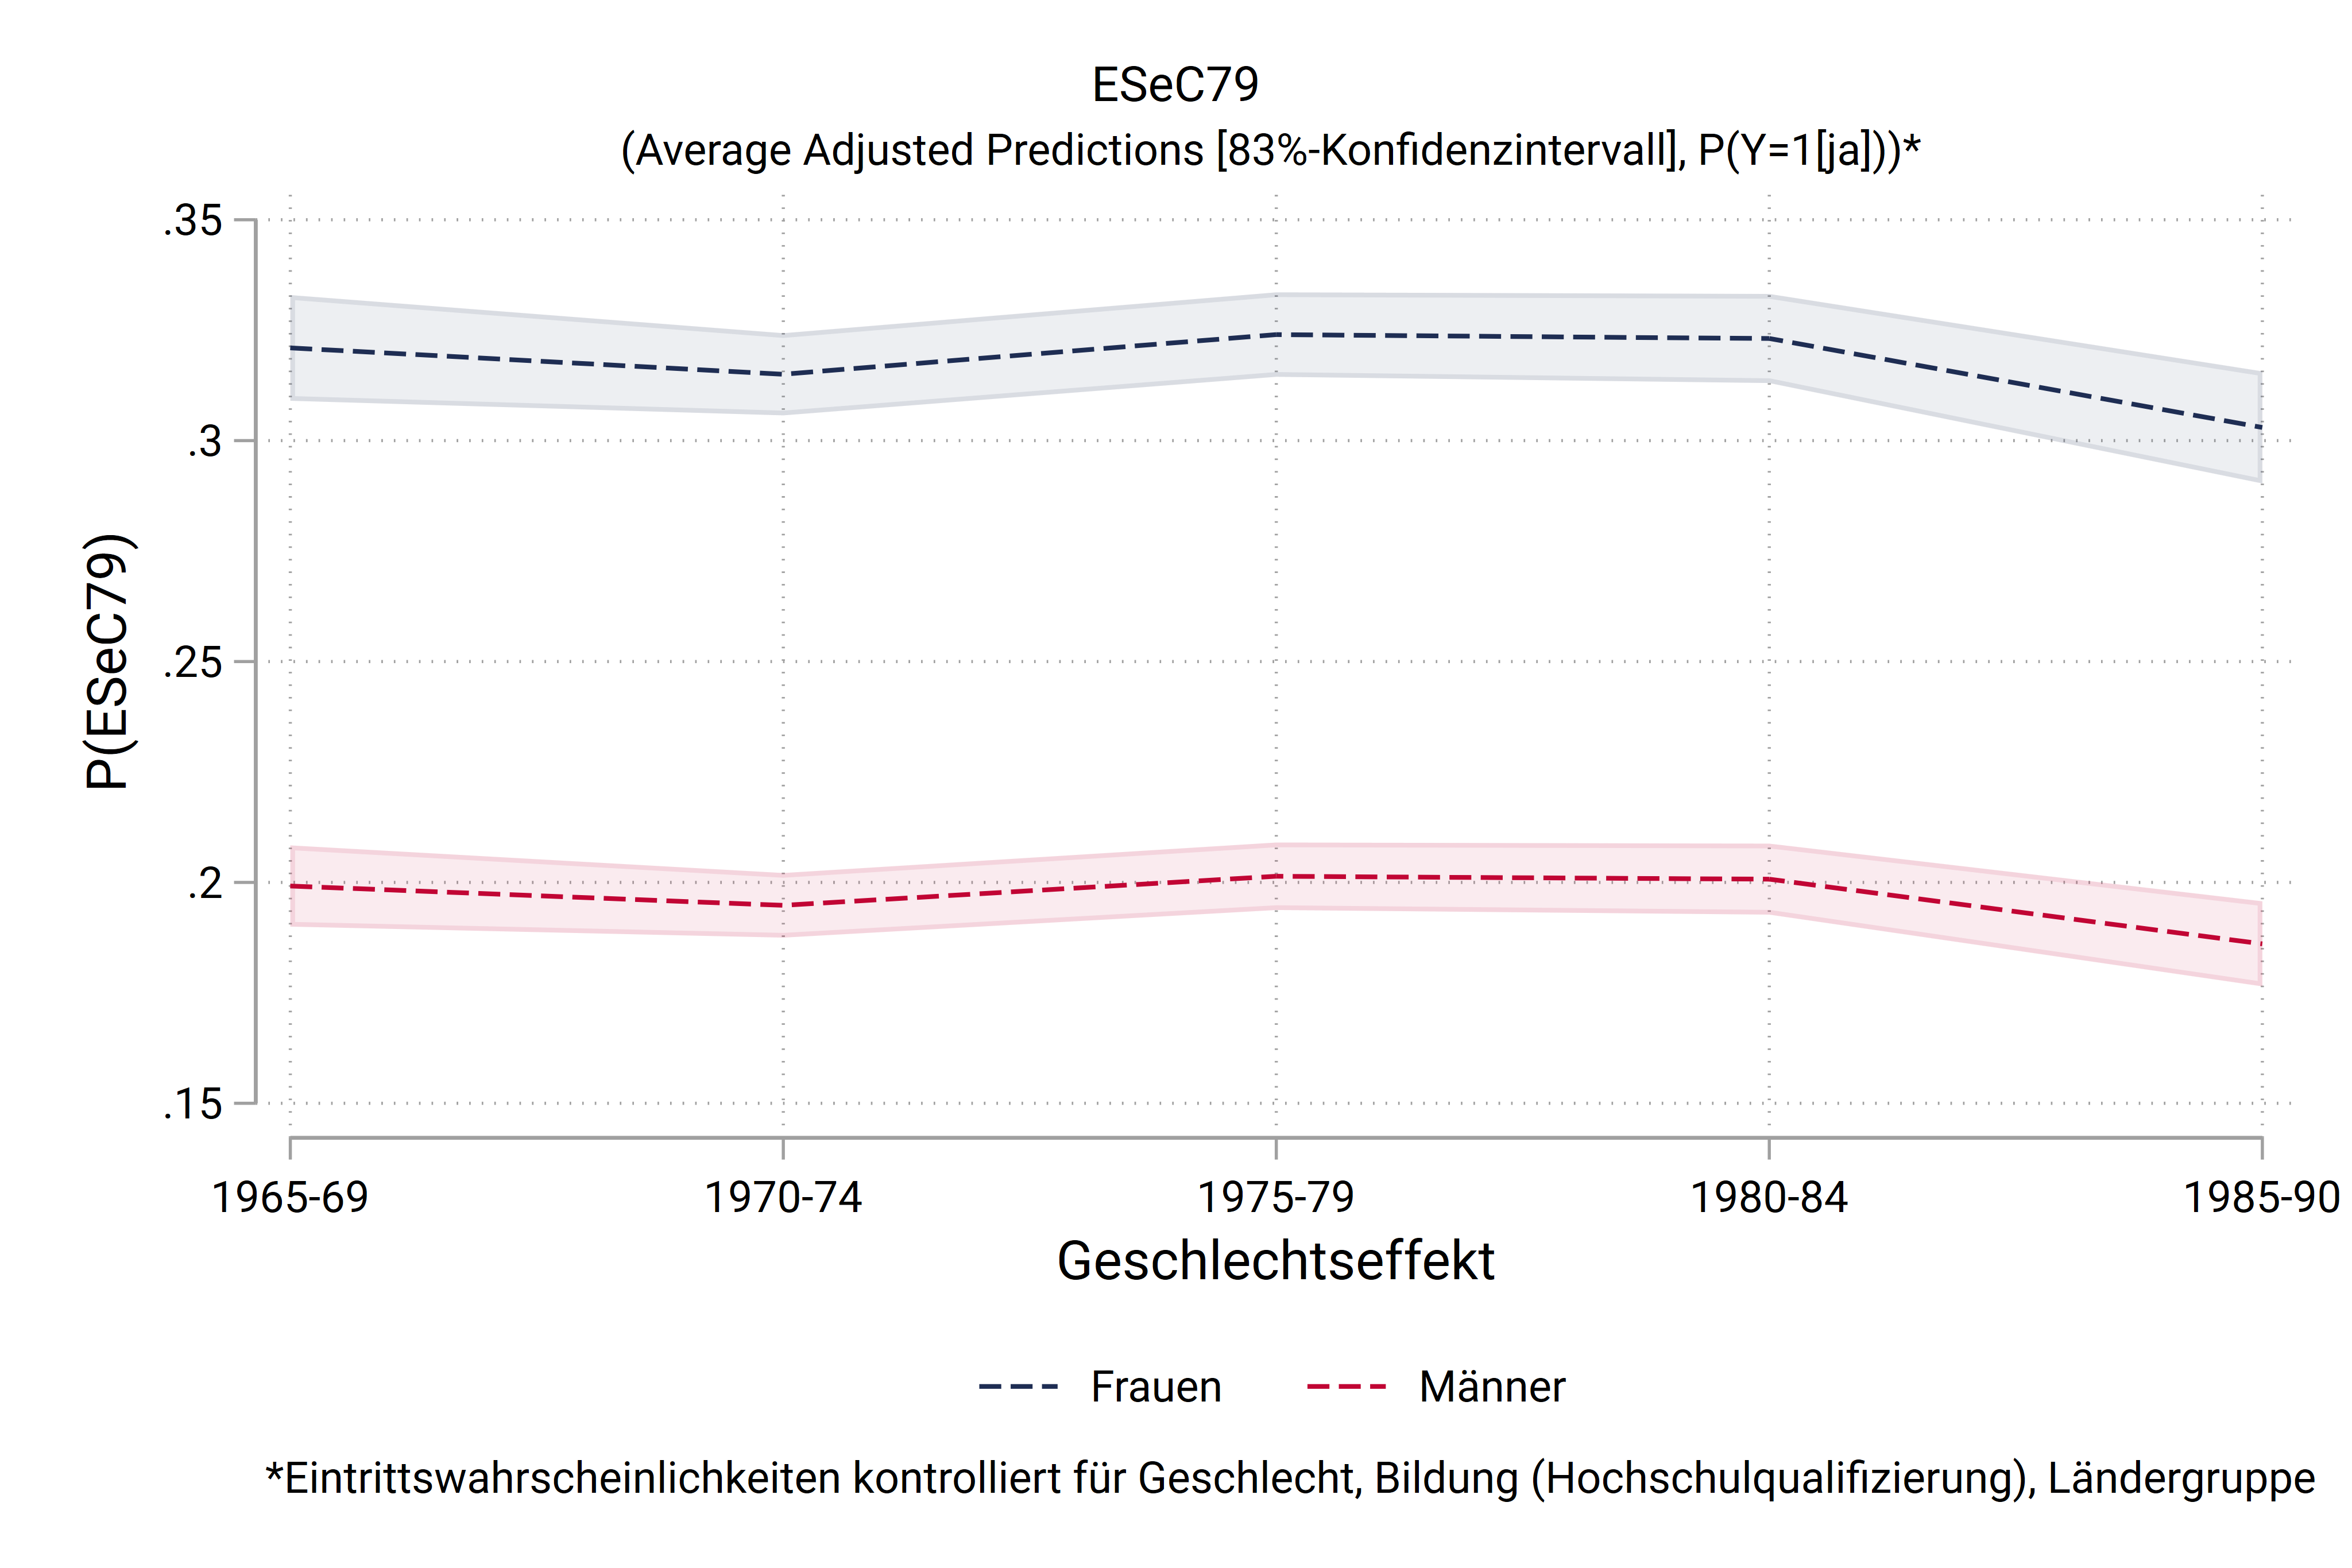
| female | 1.00 | 1.00 | 1.00 | |
| male | 0.52* | 0.52* | 0.52* | |
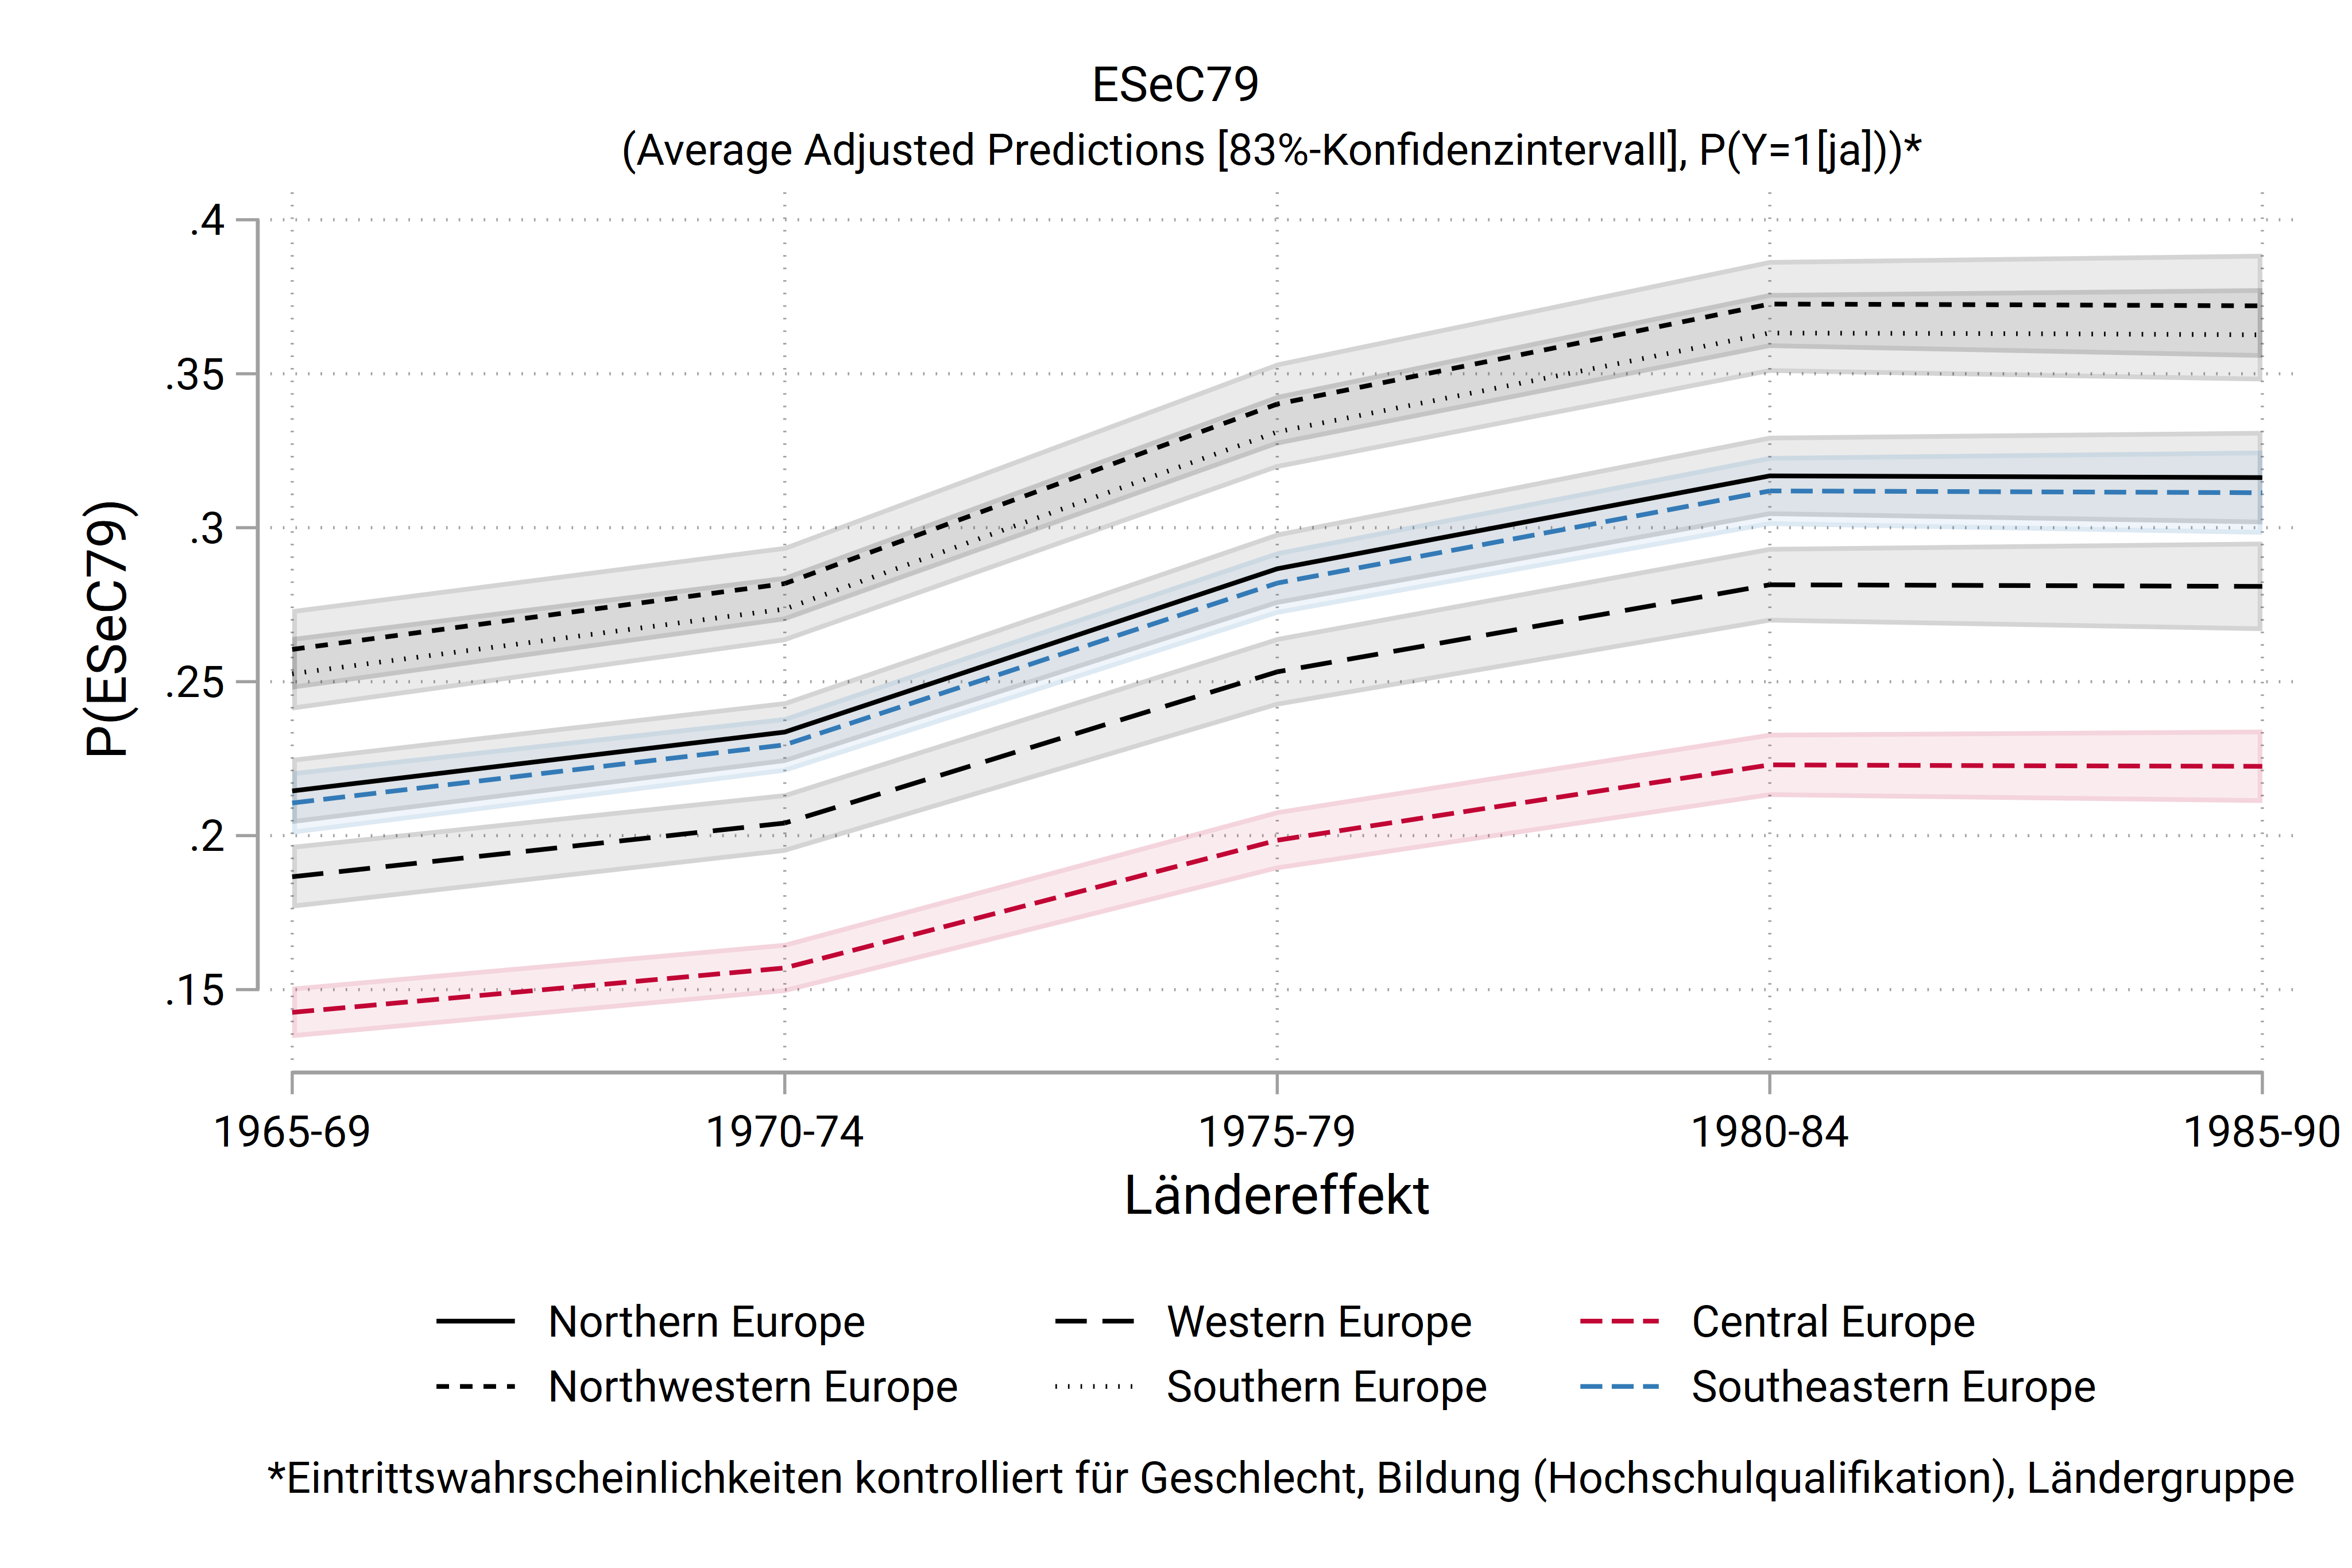
| Northern Europe | 1.00 | |||
| Western Europe | 1.02 | |||
| Central Europe | 0.93 | |||
| Northwestern Europe | 1.43* | |||
| Southern Europe (PIIGS) | 1.80* | |||
| Southeastern Europe (CEE) | 1.39* | |||
| AT | 1.00 | |||
| BE | 0.85* | |||
| CH | 0.59* | |||
| CZ | 1.12 | |||
| DE | 0.67* | |||
| DK | 0.63* | |||
| ES | 1.32* | |||
| FI | 0.82* | |||
| FR | 0.94 | |||
| GB | 1.01 | |||
| GR | 1.36* | |||
| HU | 1.49* | |||
| IE | 1.18* | |||
| IT | 1.43* | |||
| NL | 0.58* | |||
| NO | 0.72* | |||
| PL | 0.91 | |||
| PT | 1.46* | |||
| SE | 0.87* | |||
| SI | 0.74* | |||
| SK | 1.08 | |||
| Observations | 49333 | 49333 | 49333 | 49333 |
| AIC | 56603 | 55636 | 55125 | 54912 |
| BIC | 56647 | 55688 | 55222 | 55141 |
| r2_p | 0.000 | 0.017 | 0.027 | 0.031 |
|
Exponentiated coefficients
* p < .05 | ||||
| AME | |
| 1965-69 | 0.00 |
| 1970-74 | -0.01 |
| 1975-79 | 0.00 |
| 1980-84 | 0.00 |
| 1985-90 | -0.02* |
| female | 0.00 |
| male | -0.12* |
| Northern Europe | 0.00 |
| Western Europe | 0.00 |
| Central Europe | -0.01 |
| Northwestern Europe | 0.07* |
| Southern Europe (PIIGS) | 0.11* |
| Southeastern Europe (CEE) | 0.06* |
| Observations | 49333 |
| * p < .05 | |