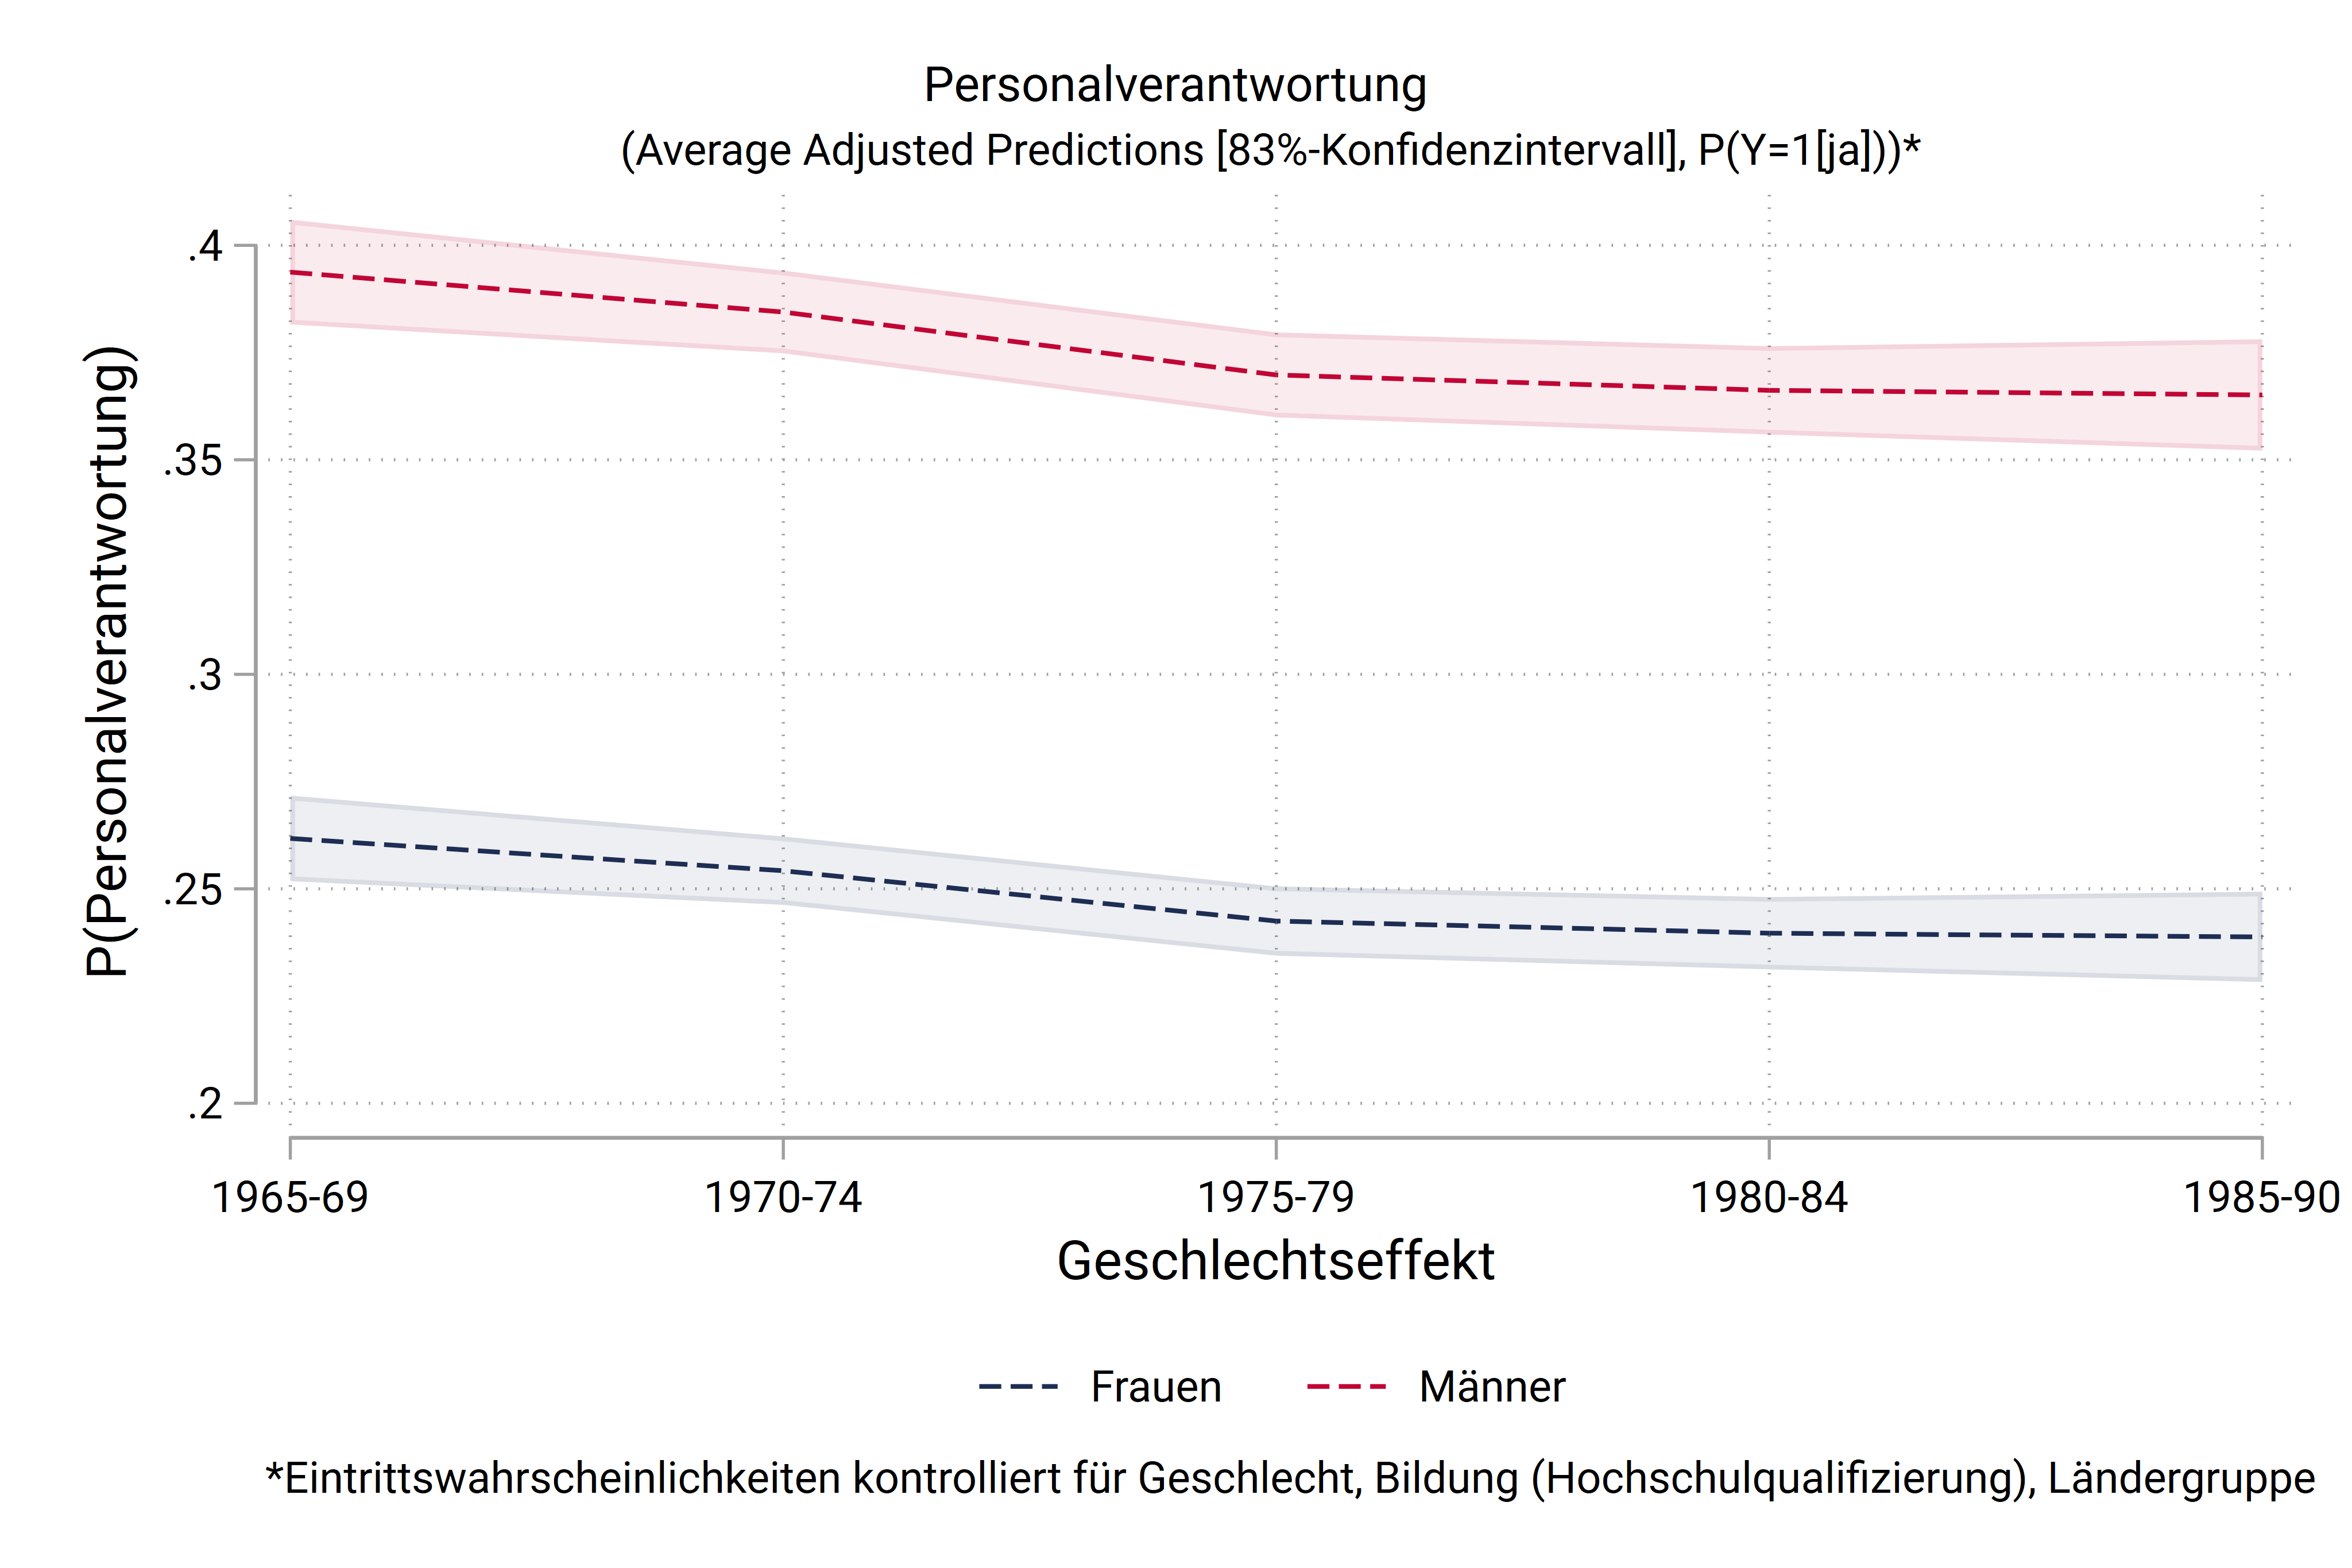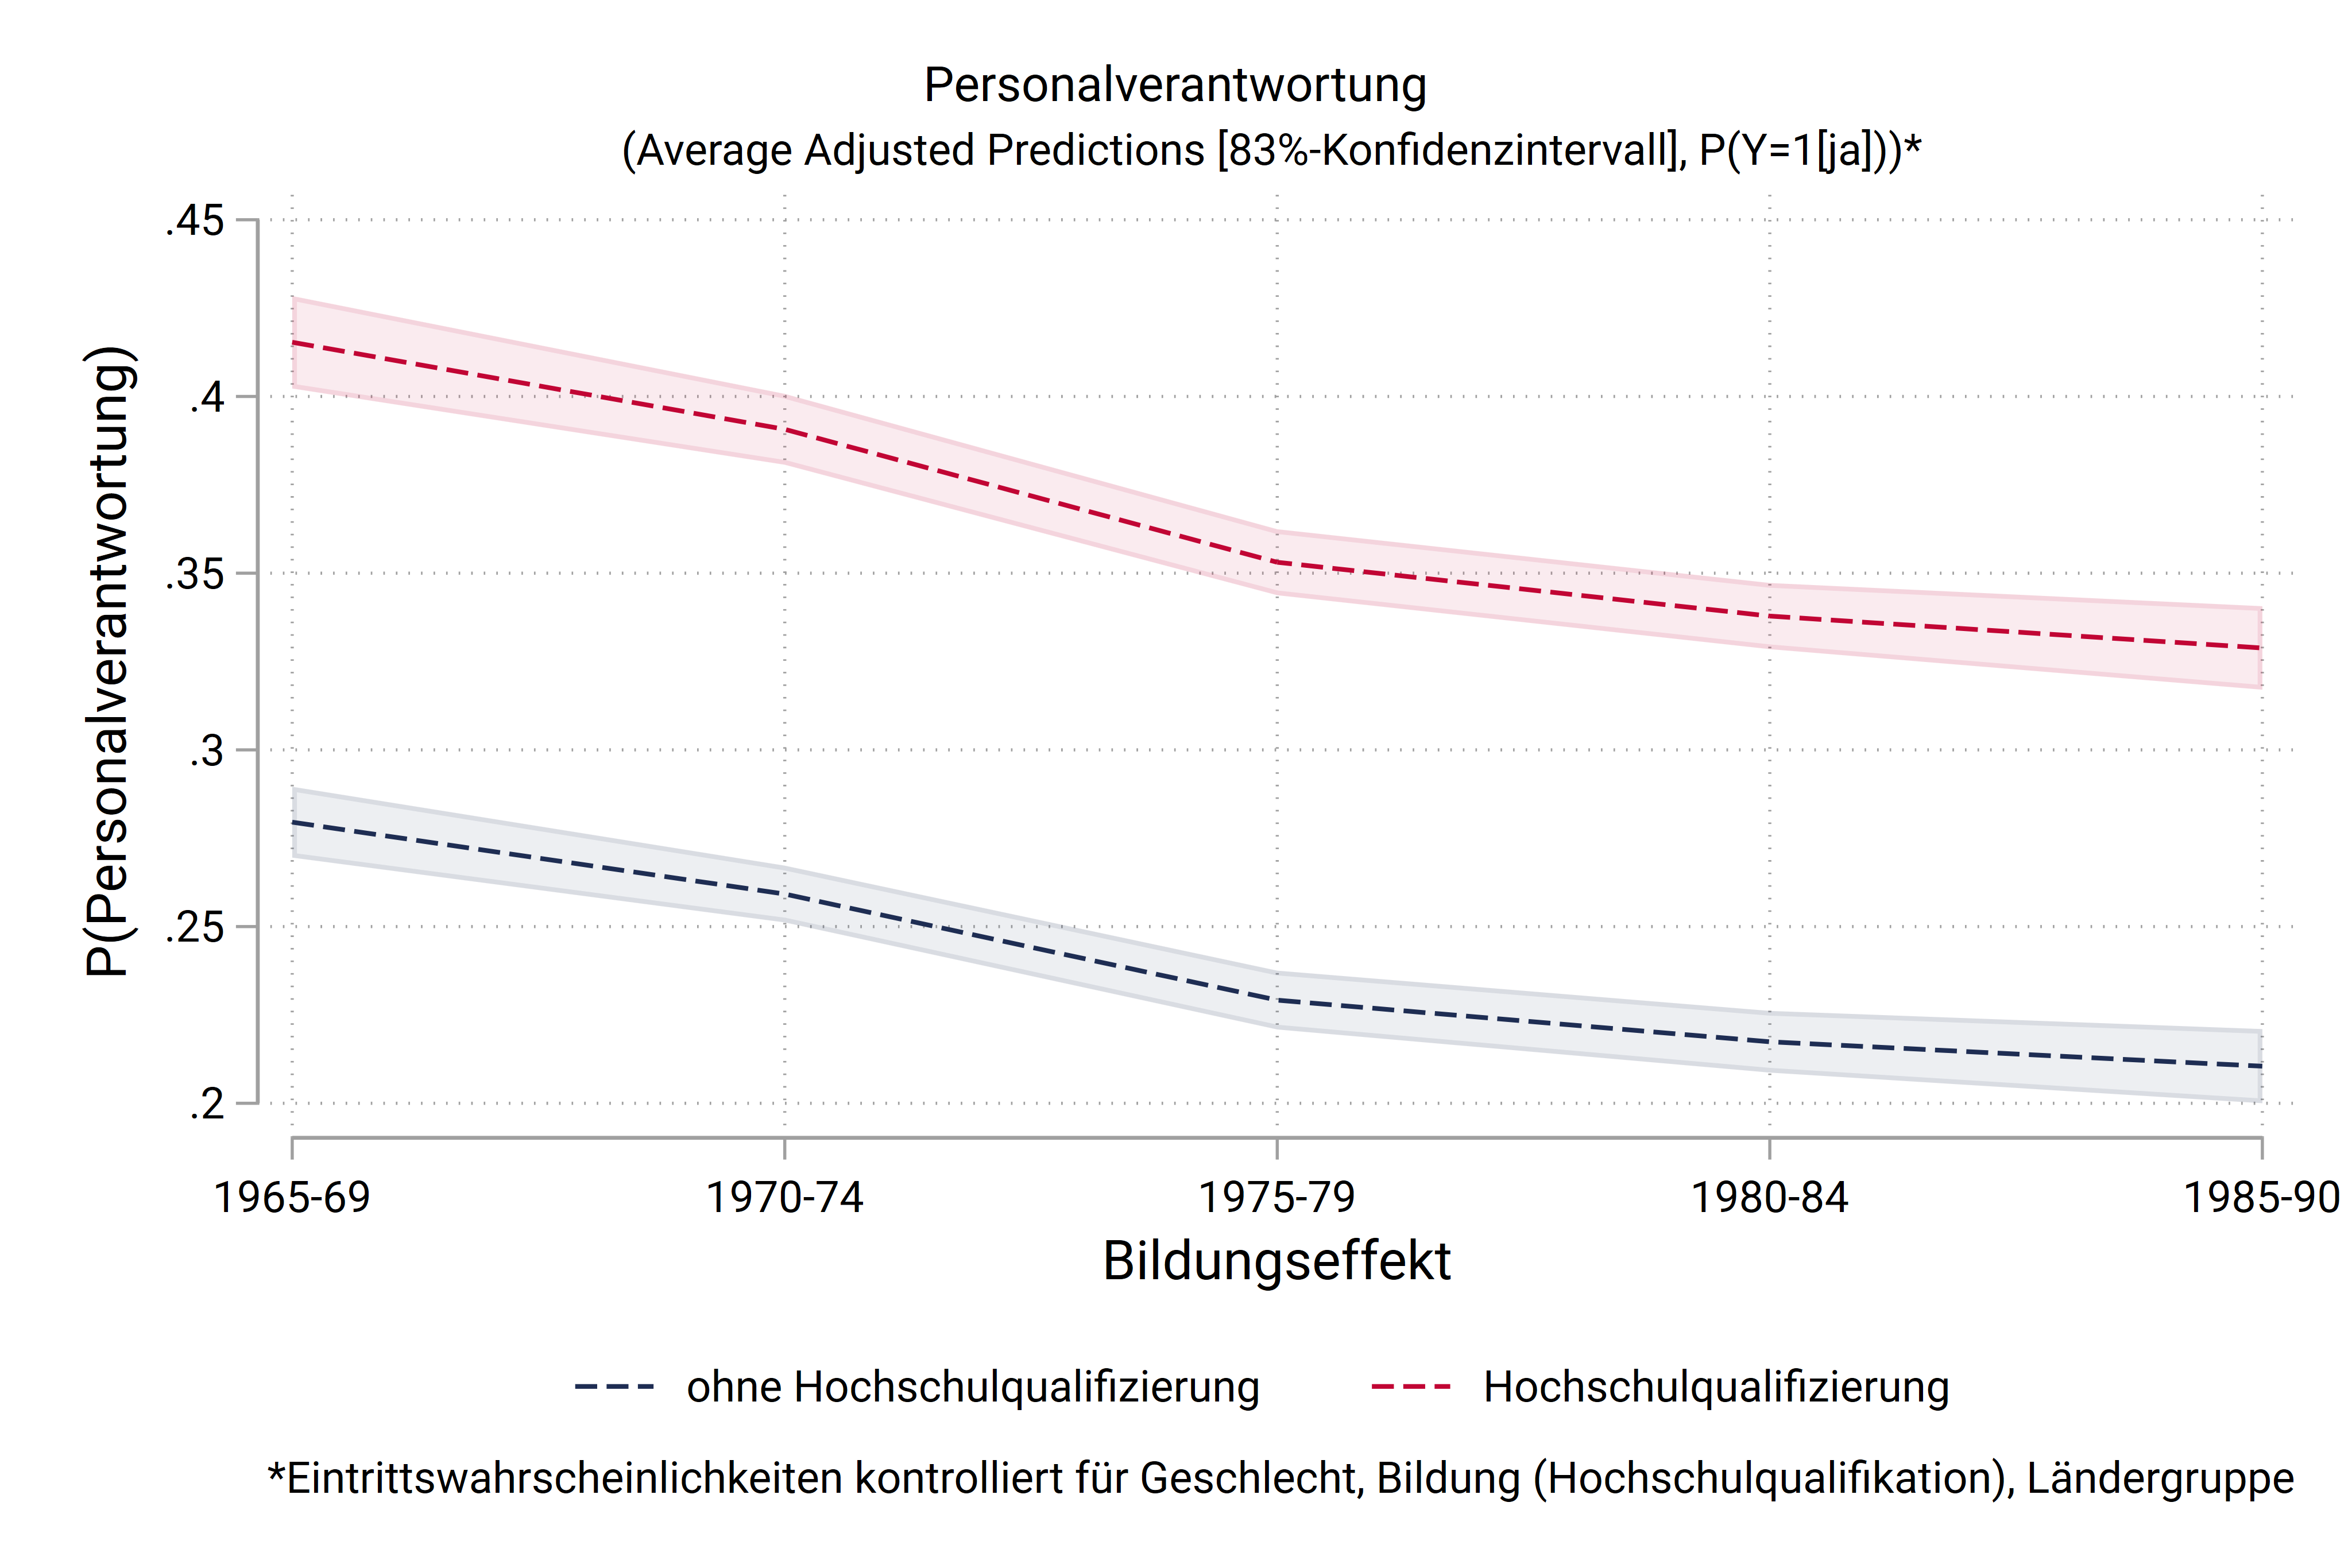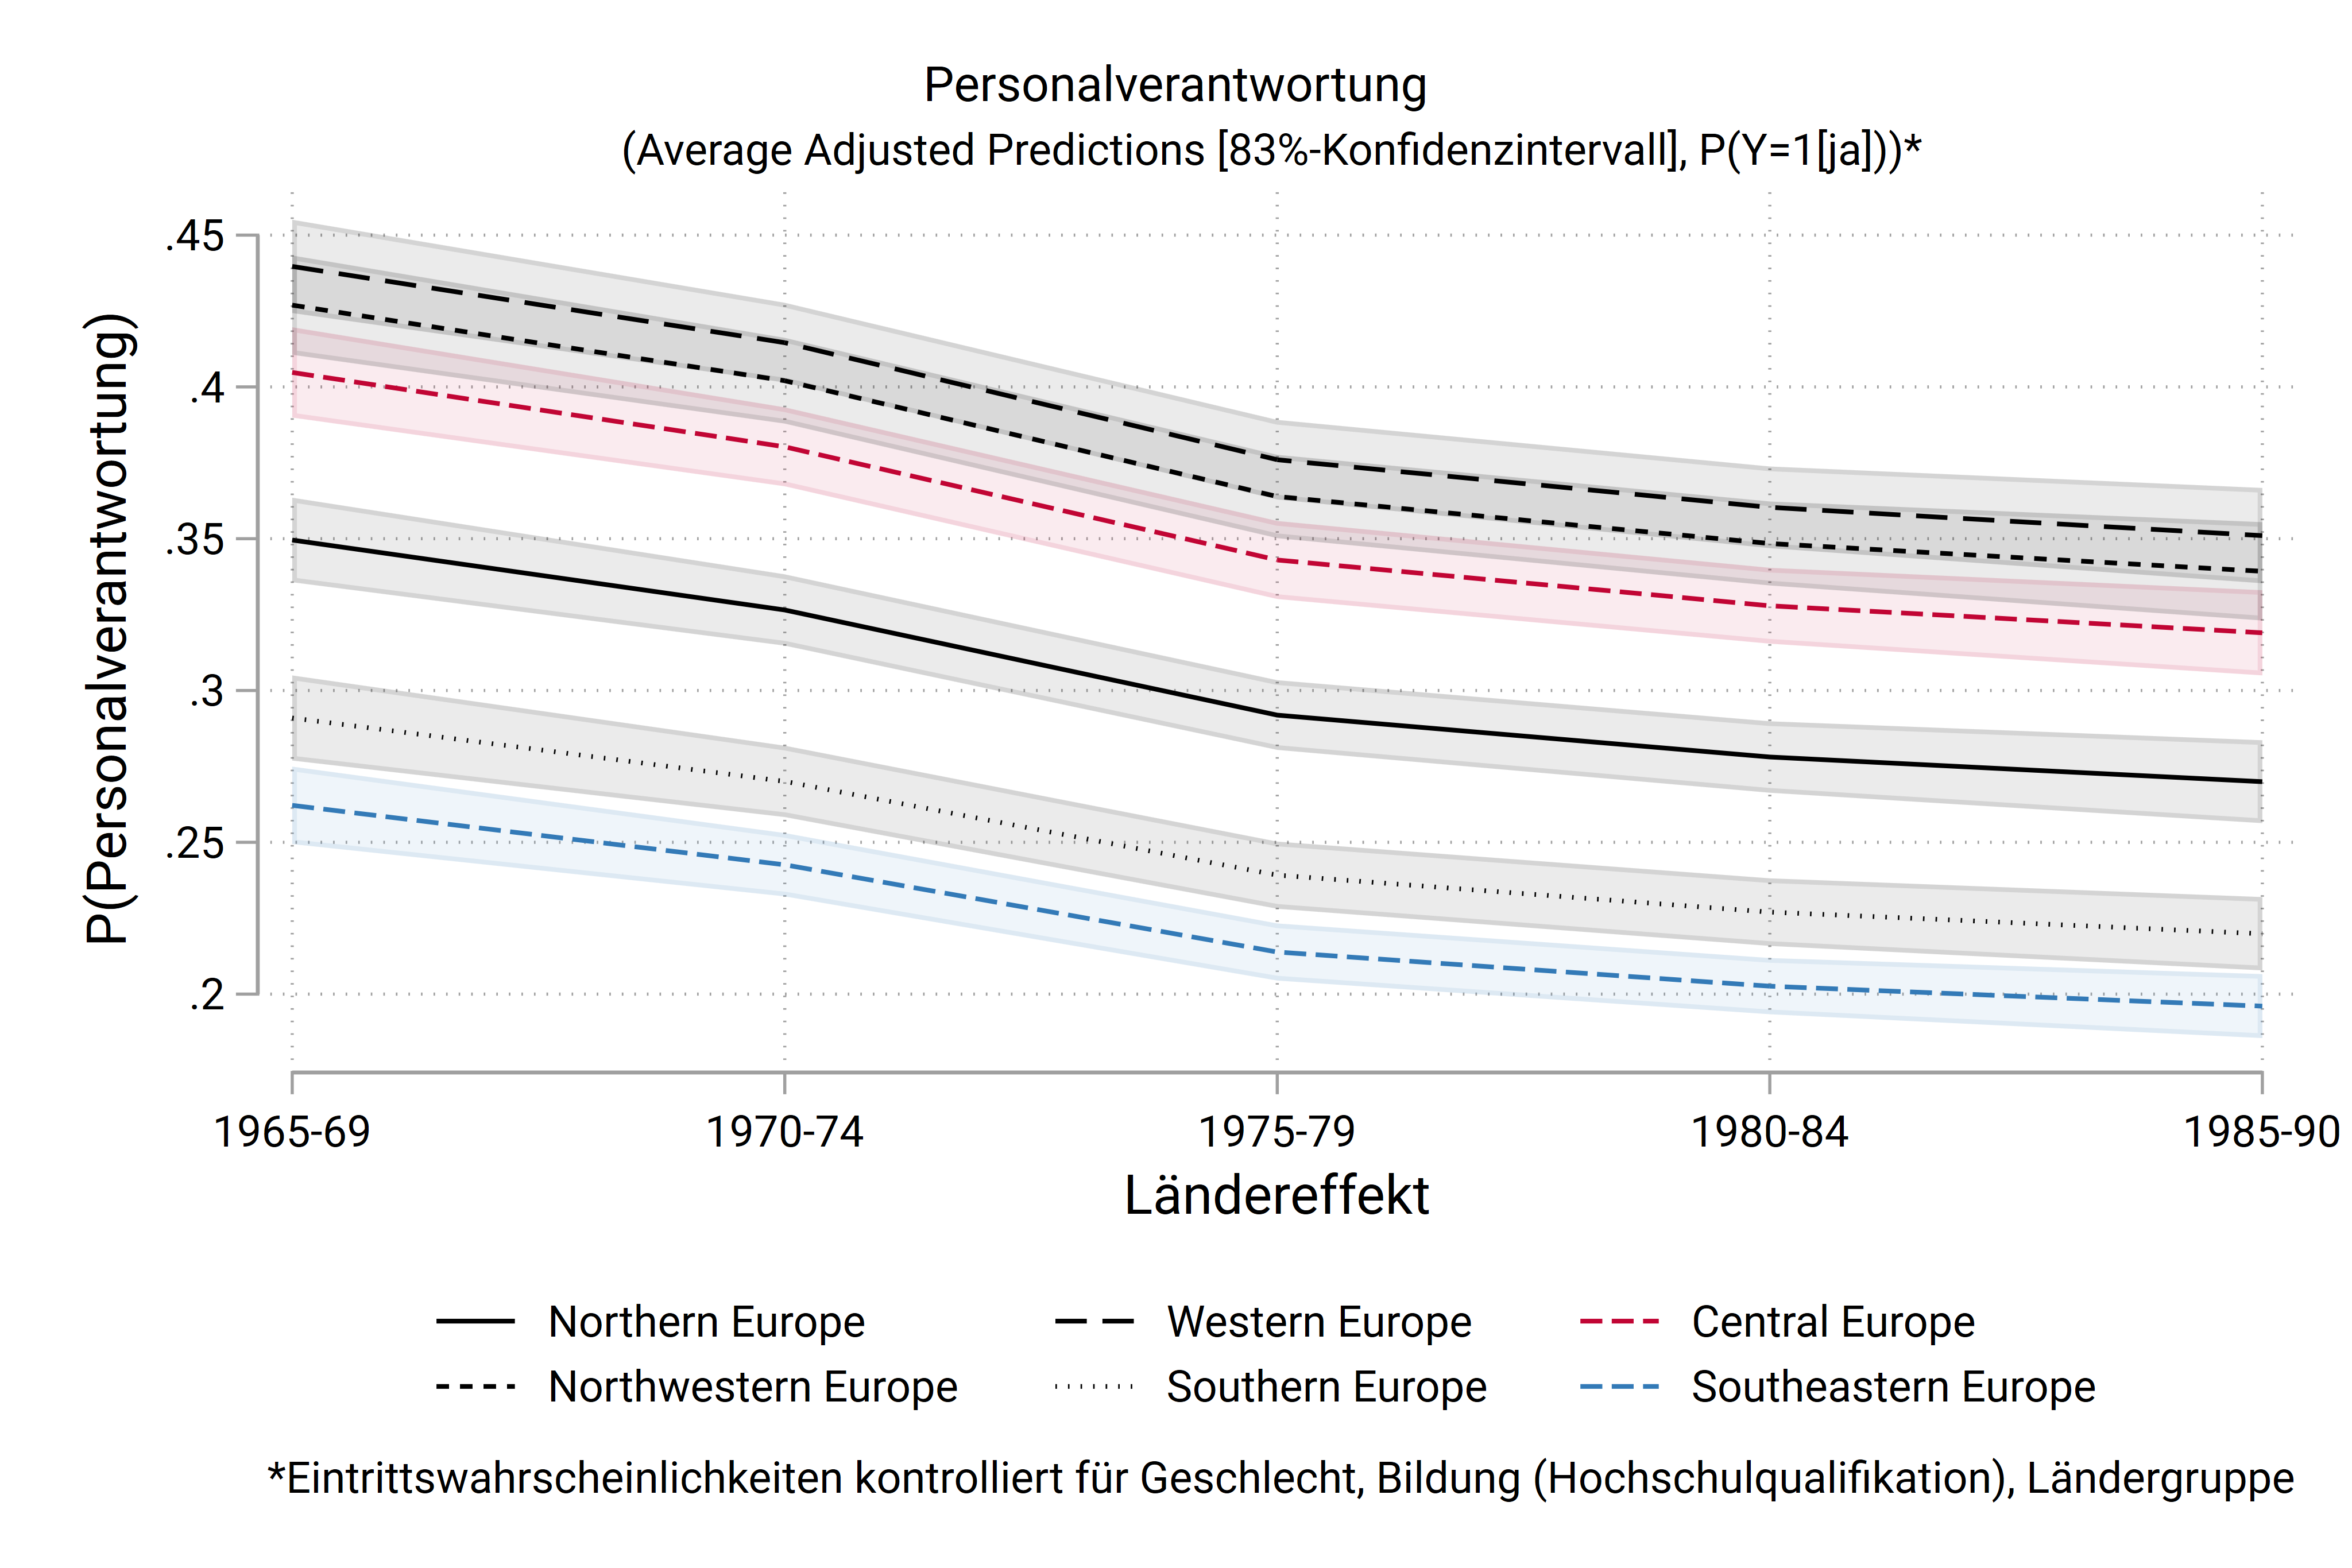
| Model 01 | Model 02 | Model 03 | Model 04 | Model 05 | |
| jbspv_gen | |||||
| 65-69 | 1.00 | 1.00 | 1.00 | 1.00 | 1.00 |
| 70-74 | 0.94 | 0.94* | 0.87* | 0.90* | 0.90* |
| 75-79 | 0.87* | 0.87* | 0.72* | 0.76* | 0.77* |
| 80-84 | 0.87* | 0.87* | 0.67* | 0.71* | 0.73* |
| 85-90 | 0.85* | 0.84* | 0.63* | 0.68* | 0.70* |
| female | 1.00 | 1.00 | 1.00 | 1.00 | |
| male | 1.82* | 1.92* | 1.95* | 1.96* | |
| NONHQ | 1.00 | 1.00 | 1.00 | ||
| HQ | 1.98* | 1.88* | 1.88* | ||
| Northern Europe | 1.00 | ||||
| Western Europe | 1.49* | ||||
| Central Europe | 1.28* | ||||
| Northwestern Europe | 1.41* | ||||
| Southern Europe (PIIGS) | 0.75* | ||||
| Southeastern Europe (CEE) | 0.65* | ||||
| AT | 1.00 | ||||
| BE | 1.63* | ||||
| CH | 2.05* | ||||
| CZ | 0.56* | ||||
| DE | 1.72* | ||||
| DK | 1.41* | ||||
| ES | 1.22* | ||||
| FI | 0.97 | ||||
| FR | 1.65* | ||||
| GB | 2.23* | ||||
| GR | 0.66* | ||||
| HU | 0.40* | ||||
| IE | 1.45* | ||||
| IT | 0.76* | ||||
| NL | 2.44* | ||||
| NO | 1.65* | ||||
| PL | 0.95 | ||||
| PT | 1.00 | ||||
| SE | 1.18* | ||||
| SI | 1.91* | ||||
| SK | 0.89 | ||||
| Observations | 50122 | 50122 | 50122 | 50122 | 50122 |
| AIC | 61950 | 60999 | 59933 | 58957 | 58123 |
| BIC | 61994 | 61052 | 59995 | 59063 | 58361 |
| r2_p | 0.001 | 0.016 | 0.033 | 0.049 | 0.063 |
|
Exponentiated coefficients
* p < .05 | |||||
| AME | |
| 65-69 | 0.00 |
| 70-74 | 0.03* |
| 75-79 | 0.06* |
| 80-84 | 0.07* |
| 85-90 | 0.07* |
| female | 0.00 |
| male | -0.04* |
| NONHQ | 0.00 |
| HQ | -0.07* |
| Northern Europe | 0.00 |
| Western Europe | -0.01 |
| Central Europe | -0.07* |
| Northwestern Europe | 0.14* |
| Southern Europe (PIIGS) | 0.15* |
| Southeastern Europe (CEE) | 0.01 |
| Observations | 43921 |
| * p < .05 | |


